Single Cell GEX Quality Control
single-cell-gex-qc.RmdIntroduction
This vignette demonstrates how to generate basic QC graphics using
GDSCtools
The workflow includes:
- Generating a scatter plot of two different GEX metrics and splitting by a grouping variable
First, designate a folder where you will store any outputs. This can be whatever or wherever you choose.
library(GDSCtools)
#>
library(Seurat)
#> Attaching SeuratObject
library(Matrix)
library(purrr)

#----- Set a directory to hold outputs
outputDir <- c("/Users/mike/Desktop/")
Let’s simulate some single cell with data for the purposes of this vignette.
set.seed(42)

simulate_seurat_object <- function(n_cells, sample_name) {
  # Simulate sparse count matrix
  expr <- rpois(n = 2000 * n_cells, lambda = 1)
  expr[sample(length(expr), size = length(expr) * 0.9)] <- 0  # Sparsify
  mat <- Matrix::Matrix(data = expr, nrow = 2000, ncol = n_cells, sparse = TRUE)
  rownames(mat) <- paste0("Gene", 1:2000)
  colnames(mat) <- paste0(sample_name, "_cell", 1:n_cells)

  # Create Seurat object
  seu <- CreateSeuratObject(counts = mat, project = sample_name)

  # Simulate QC metadata
  seu$nFeature_RNA <- Matrix::colSums(mat > 0)
  seu$nCount_RNA <- Matrix::colSums(mat)
  seu$percent.mt <- rnorm(n_cells, mean = 5, sd = 2)

  # Inject outliers (5 random cells)
  outlier_cells <- sample(colnames(seu), size = 5)
  seu$nFeature_RNA[outlier_cells] <- seu$nFeature_RNA[outlier_cells] * 4
  seu$nCount_RNA[outlier_cells] <- seu$nCount_RNA[outlier_cells] * 6
  seu$percent.mt[outlier_cells] <- seu$percent.mt[outlier_cells] + 20

  return(seu)
}

# Create 3 dummy datasets
dummySamples <- list(
  S1 = simulate_seurat_object(n_cells = 9234, sample_name = "S1"),
  S2 = simulate_seurat_object(n_cells = 6763, sample_name = "S2"),
  S3 = simulate_seurat_object(n_cells = 7996, sample_name = "S3")
)
To generate a metadata table we can use for downstream QC analysis, we can merge the metadata.
metadata <- mergeMetadata(dummySamples)
colnames(metadata)
#> [1] "orig.ident" "nCount_RNA" "nFeature_RNA" "percent.mt" "cell_id"
#----- Get a vector of unique samples
samples <- unique(metadata$orig.ident)
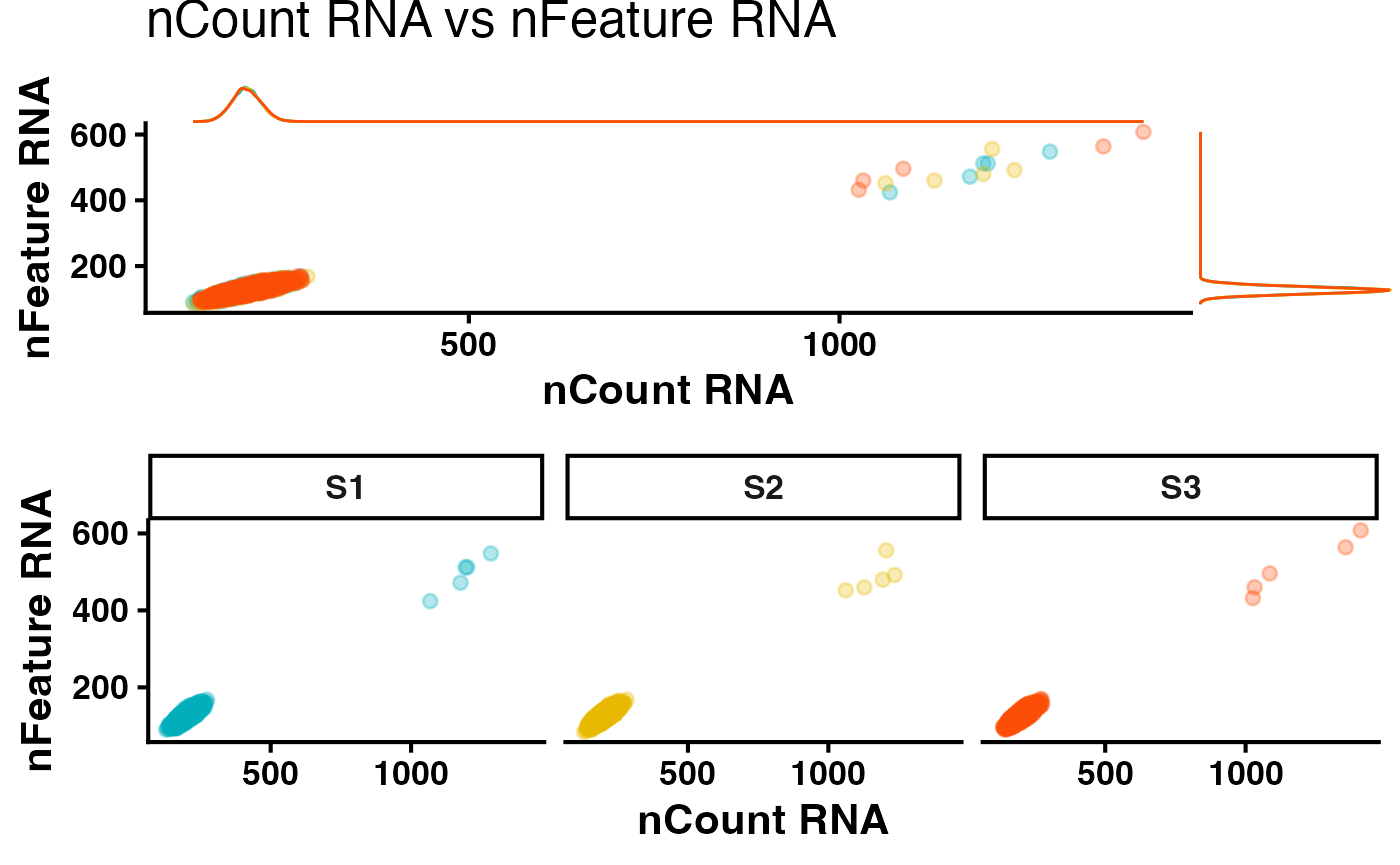
colors <- c("#00AFBB", "#E7B800", "#FC4E07")Generating a QC scatter plot is a good way to begin to assess your data quality.
#----- Create a scatter plot
qcScatter(metadata = metadata,
          Xvar = "nCount_RNA",
          Yvar = "nFeature_RNA",
          logTransformX = FALSE,
          logTransformY = FALSE,
          colors = colors,
          width = 8,
          height = 8)